
Training ROI is calculated as net programme benefit divided by total programme cost, expressed as a percentage. The hard part is not the arithmetic, it is isolating the financial benefit and agreeing what counts before the programme runs. Decide the metric and capture a baseline first, or you will be reconstructing a business case after the fact.
Why this has become L&D's biggest problem
Proving impact has overtaken learner engagement as the number one challenge in learning and development. Thirst's State of L&D for SMBs 2026 report, surveying more than 3,000 professionals, found 64 percent say leadership now expects proof of learning impact. LinkedIn Learning's 2026 Workplace Learning Report found only 8 percent of L&D leaders can demonstrate business impact from training in financial terms, while 72 percent report being asked to justify spend more rigorously than before.
Set against global corporate training expenditure of roughly 102.8 billion dollars, that gap is remarkable. An enormous amount of money is spent by a function that mostly cannot say what it bought. Programmes that cannot show a connection to business performance are the first cut when budgets tighten.
This guide gives you the formula, a worked example, and, more importantly, the sequence that makes the calculation possible at all.
The formula
Training ROI uses the same formula as any other investment:
| ROI percentage = ((Net programme benefit minus Total programme cost) divided by Total programme cost) multiplied by 100. |
So a programme costing 20,000 dollars that produces 50,000 dollars of measurable benefit returns ((50,000 - 20,000) / 20,000) x 100, which is 150 percent.
The arithmetic is trivial. Every difficulty lives in the two inputs, so most of this guide is about getting those right.
Getting the cost side right
Costs are the easier half, but they are routinely understated, which inflates ROI and destroys credibility the moment finance checks the numbers. Include:
- Platform and content costs: the LMS subscription attributable to the programme, plus any purchased courseware.
- Development cost: hours spent building content, at loaded salary cost. Industry benchmarks put content creation at roughly 20 to 40 hours per finished course.
- Delivery cost: facilitator time, venue, travel for any in-person element.
- Administration: the hours spent assigning, chasing and reporting.
- Learner time. This is the biggest line and the most commonly omitted. Two hours of training for 500 people at an average loaded rate of 40 dollars an hour is 40,000 dollars of time, which will usually dwarf your content budget.
| Include learner time. Leaving it out is the single fastest way to lose a finance director's confidence, because it is the first thing they will add back. Including it also strengthens the argument for shorter formats, since the time cost is real money. |
Getting the benefit side right, which is the actual work
Benefit is where ROI calculations succeed or collapse. The rule: you must choose one measurable business metric before the programme runs, and capture a baseline.
- Pick a metric the training could plausibly move: safety incidents, error or rework rates, time to competency for new hires, first-contact resolution, sales conversion, voluntary turnover in a specific team.
- Capture the baseline before training. Without it you have no comparison and no argument.
- Convert the change to money. Fewer incidents equals avoided cost per incident. Faster ramp equals weeks of productivity gained. Lower turnover equals avoided replacement cost.
- Isolate the training's contribution. This is the step most people skip and the one that gets challenged first.
On isolation: if sales rose 12 percent after training, training did not necessarily cause 12 percent. Pricing changed, a competitor stumbled, seasonality happened. Credible approaches include comparing a trained group against a matched untrained control group, using trend-line analysis to project what would have happened without the intervention, or asking managers and participants to estimate the training's contribution and applying a confidence adjustment.
Estimation with a stated confidence factor is entirely legitimate, provided you show your working. A defensible 60 percent attribution beats an indefensible 100 percent.
A worked example
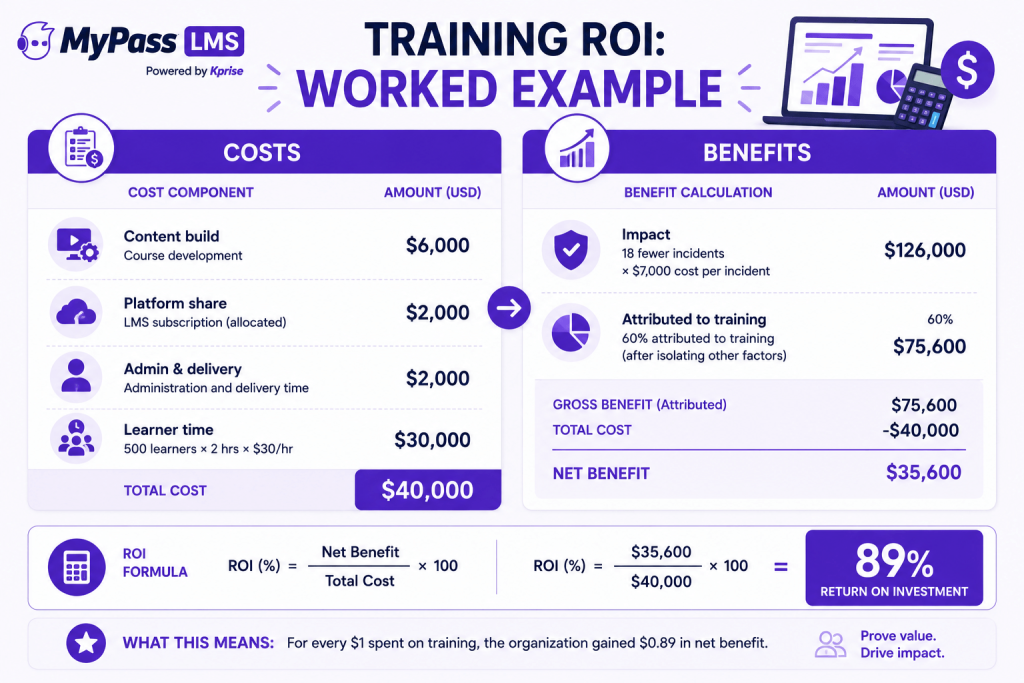
A manufacturer runs safety training for 250 frontline staff.
- Costs. Content build 6,000 dollars. Share of platform cost 2,000 dollars. Administration 2,000 dollars. Learner time, three hours each at 40 dollars, 30,000 dollars. Total cost 40,000 dollars.
- Baseline. The site averaged 30 recordable incidents a year, at an average fully loaded cost of 7,000 dollars each.
- Result. Incidents fell to 12 in the following year, a reduction of 18, worth 126,000 dollars.
- Isolation. Two other changes happened that year: new guarding on one line and a supervisor change. Managers estimate training accounted for roughly 60 percent of the improvement, so 75,600 dollars is attributed.
- ROI. ((75,600 - 40,000) / 40,000) x 100, which is 89 percent.
That is a defensible number. It includes learner time, it discounts for other causes, and it rests on a metric captured before the programme started rather than assembled afterwards.
Where ROI sits among your other measures
ROI is not the only measure and should not be the first one you reach for. The Kirkpatrick model's four levels, reaction, learning, behaviour and results, form the ladder, with ROI often described as a fifth level built on top of level four.
The practical implication is that you cannot calculate ROI without having measured results, and you cannot measure results without having chosen the metric in advance. Measuring training effectiveness properly is therefore the prerequisite, not a parallel exercise.
It is also worth being honest that not every programme needs an ROI calculation. Compliance training is a risk-mitigation cost, and the right framing there is the cost of the alternative, meaning fines, findings and liability, rather than a return percentage. Reserve ROI analysis for programmes where a business metric genuinely moves.
Making the data available at all
One reason so few teams can produce financial impact numbers is that the underlying learning data is scattered or incomplete. Before any of the above works, you need reliable answers to who completed what, when, and how they scored.
That means completion, assessment and timing data captured automatically as training happens, cohort-level reporting so trained and untrained groups can be compared, and exportable records you can join to business data in a spreadsheet or BI tool. Reporting that produces those cohorts on demand is what turns the ROI exercise from a research project into a routine one.
The bottom line
Training ROI is simple arithmetic wrapped around two hard inputs. Cost is easy to get right if you are honest, and learner time belongs in it. Benefit requires choosing a business metric before the programme runs, capturing a baseline, converting the change to money, and discounting for everything else that could have caused it. Do that and you can answer the question 64 percent of leadership teams are now asking, in the terms the 8 percent already use.
MyPass LMS captures completion, assessment and timing data automatically and exports cohort-level reporting you can join to business data. See the platform features, or start a 15-day free trial with no credit card.
Frequently asked questions
What is the formula for training ROI?
ROI percentage equals net programme benefit minus total programme cost, divided by total programme cost, multiplied by 100. A programme costing 20,000 dollars that delivers 50,000 dollars of measurable benefit returns 150 percent.
What costs should be included in training ROI?
Platform and content costs, development hours at loaded salary cost, delivery and facilitation, administration time, and learner time. Learner time is usually the largest line and the most commonly omitted, which inflates ROI and undermines credibility with finance.
How do you isolate training's impact from other factors?
Compare a trained group against a matched untrained control group, use trend-line analysis to project what would have happened without the training, or collect manager and participant estimates of the training's contribution and apply a stated confidence factor. Showing the adjustment is more persuasive than claiming full attribution.
Why can't most L&D teams prove training ROI?
Because the metric is chosen after the programme rather than before it. LinkedIn Learning's 2026 report found only 8 percent of L&D leaders can demonstrate business impact in financial terms, largely because no baseline was captured and no business metric was agreed in advance.
Does every training programme need an ROI calculation?
No. Compliance training is a risk-mitigation cost, better framed as the cost of the alternative in fines, findings and liability than as a return percentage. Reserve ROI analysis for programmes targeting a business metric that can genuinely move.